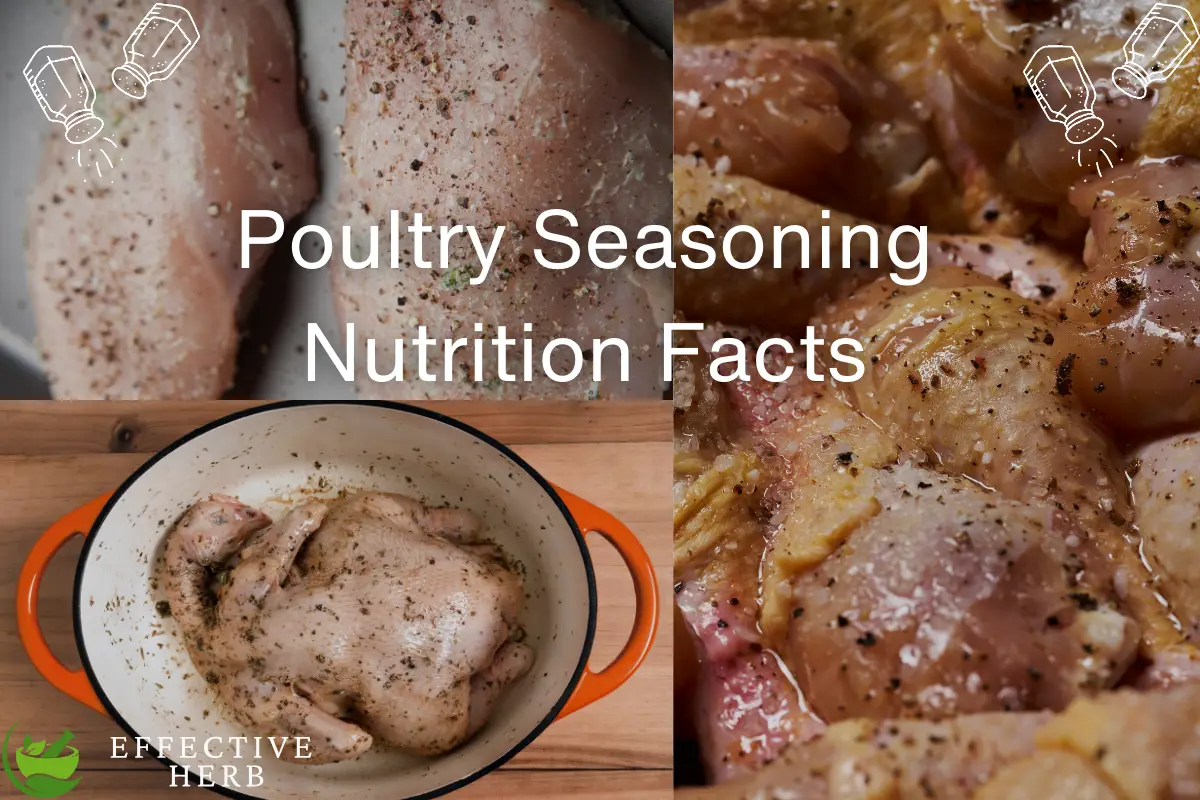
Poultry Seasoning Nutrition Facts
Discover the nutrition facts of poultry seasoning in this blog post. Poultry seasoning is a flavorful blend of herbs and spices commonly used to season chicken, turkey, and other poultry dishes. Understanding its nutritional content can help you make informed choices about your seasoning options and overall diet.
Full Nutrient Table
The below nutrition table is based on a 100-gram portion of poultry seasoning. While the exact nutritional content may vary depending on the specific blend, poultry seasoning typically contains a mix of herbs such as sage, thyme, marjoram, and rosemary. These herbs are low in calories and rich in antioxidants, vitamins, and minerals, offering both flavor and nutritional benefits to your dishes.
| Name | amount | Unit |
|---|---|---|
| Proximates | ||
| Water | 9.31 | g |
| Energy | 307 | kcal |
| Energy | 1280 | kJ |
| Protein | 9.59 | g |
| Total lipid (fat) | 7.53 | g |
| Ash | 5.92 | g |
| Carbohydrates | ||
| Carbohydrate, by difference | 65.6 | g |
| Fiber, total dietary | 11.3 | g |
| Sugars, total including NLEA | 1.8 | g |
| Minerals | ||
| Calcium, Ca | 996 | mg |
| Iron, Fe | 35.3 | mg |
| Magnesium, Mg | 224 | mg |
| Phosphorus, P | 171 | mg |
| Potassium, K | 684 | mg |
| Sodium, Na | 27 | mg |
| Zinc, Zn | 3.14 | mg |
| Copper, Cu | 0.843 | mg |
| Manganese, Mn | 6.86 | mg |
| Selenium, Se | 7.2 | µg |
| Vitamins and Other Components | ||
| Vitamin C, total ascorbic acid | 12 | mg |
| Thiamin | 0.264 | mg |
| Riboflavin | 0.191 | mg |
| Niacin | 2.97 | mg |
| Vitamin B-6 | 1.32 | mg |
| Folate, total | 138 | µg |
| Folic acid | 0 | µg |
| Folate, food | 138 | µg |
| Folate, DFE | 138 | µg |
| Choline, total | 30.3 | mg |
| Vitamin B-12 | 0 | µg |
| Vitamin B-12, added | 0 | µg |
| Vitamin A, RAE | 132 | µg |
| Retinol | 0 | µg |
| Carotene, beta | 1570 | µg |
| Carotene, alpha | 0 | µg |
| Cryptoxanthin, beta | 23 | µg |
| Vitamin A, IU | 2630 | IU |
| Lycopene | 7 | µg |
| Lutein + zeaxanthin | 1110 | µg |
| Vitamin E (alpha-tocopherol) | 1.32 | mg |
| Vitamin E, added | 0 | mg |
| Vitamin D (D2 + D3), International Units | 0 | IU |
| Vitamin D (D2 + D3) | 0 | µg |
| Vitamin K (phylloquinone) | 805 | µg |
| Lipids | ||
| Fatty acids, total saturated | 3.29 | g |
| SFA 4:0 | 0 | g |
| SFA 6:0 | 0 | g |
| SFA 8:0 | 0.128 | g |
| SFA 10:0 | 0.135 | g |
| SFA 12:0 | 0.125 | g |
| SFA 14:0 | 1.22 | g |
| SFA 16:0 | 1.28 | g |
| SFA 18:0 | 0.36 | g |
| Fatty acids, total monounsaturated | 1.21 | g |
| MUFA 16:1 | 0.082 | g |
| MUFA 18:1 | 1.11 | g |
| MUFA 20:1 | 0 | g |
| MUFA 22:1 | 0 | g |
| Fatty acids, total polyunsaturated | 1.94 | g |
| PUFA 18:2 | 0.992 | g |
| PUFA 18:3 | 0.944 | g |
| PUFA 18:4 | 0 | g |
| PUFA 20:4 | 0 | g |
| PUFA 2:5 n-3 (EPA) | 0 | g |
| PUFA 22:5 n-3 (DPA) | 0 | g |
| PUFA 22:6 n-3 (DHA) | 0 | g |
| Fatty acids, total trans | 0 | g |
| Cholesterol | 0 | mg |
| Phytosterols | 96 | mg |
| Amino acids | ||
| Alcohol, ethyl | 0 | g |
| Caffeine | 0 | mg |
| Theobromine | 0 | mg |
| Name | amount | Unit |
Nutritional Charts for poultry seasoning
Nutrient Composition Pie Chart
This chart shows the proportion of different macronutrients (protein, fat, carbohydrate) and micronutrients (vitamins and minerals) in the food.
Macronutrient Distribution Bar Chart
This chart displays the distribution of macronutrients (protein, fat, carbohydrate) in the food.
Mineral and Vitamin Bar Chart
This chart illustrates the distribution of essential minerals and vitamins in the food.
Conclusion
Poultry seasoning is not only flavorful but also offers nutritional benefits. With a rich array of vitamins and minerals, it is a healthy addition to a balanced diet. Incorporate this seasoning into your meals to enjoy both its taste and health advantages. Source